
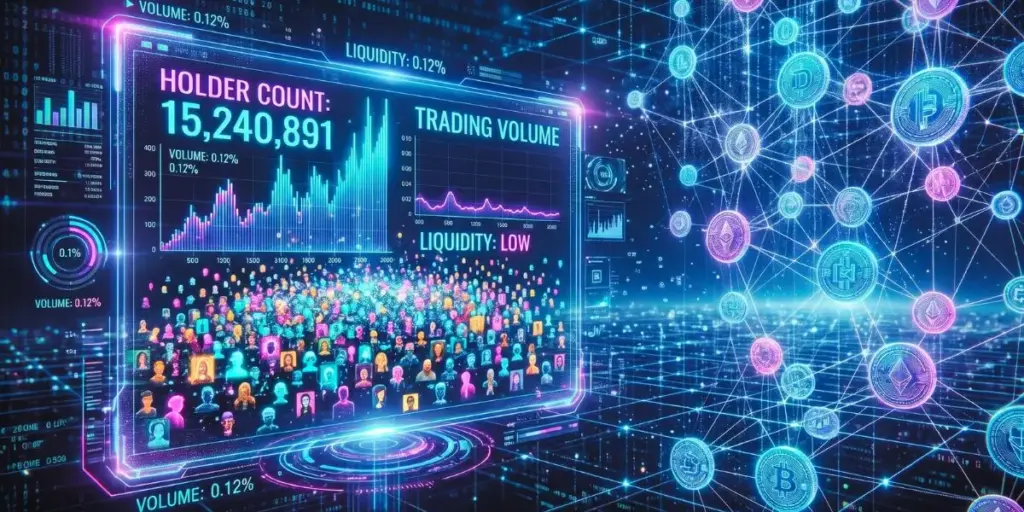

A token can have two million holders and still be nearly impossible to sell without moving the price. That contradiction confuses many investors because “holders” sounds like demand, while liquidity is actually about whether buyers and sellers can trade meaningful size quickly, at a fair price, and with limited slippage. In crypto, holder count measures distribution; liquidity measures tradability—and the two are not the same thing.
This article explains why a token with a large holder base can still have thin liquidity, how market makers, liquidity pools, token unlocks, and holder concentration create the gap, and how to evaluate a token before you buy. You will also get a practical checklist for distinguishing genuine community ownership from a holder count that masks concentrated, illiquid supply.
Holders Do Not Equal Liquidity
A holder is any blockchain address with a nonzero token balance. Liquidity is the amount of capital available to absorb buy or sell orders near the current market price. A token can be widely distributed across millions of small wallets yet have almost no active market depth.
Think of a neighborhood with thousands of homeowners. If almost nobody is willing to sell, and only a few buyers are standing by, the neighborhood may look “popular” but still have a thin market. Crypto works similarly: millions of addresses can hold a token, but if very little of it is actively offered for sale—or if buyers will only purchase at much lower prices—the market remains shallow.
Liquidity has several practical dimensions:
-
Tight spreads: The difference between the best bid and ask is small.
-
Depth: Large orders can be filled without a major price move.
-
Low slippage: A $10,000 trade does not materially change the execution price.
-
Fast settlement: Orders execute promptly on active venues.
-
Resilient volume: Trading activity is sustained, not a one-day spike.
Kaiko defines liquidity as how efficiently a token can be bought and sold, and notes that depth and volume are central components of that assessment. On decentralized exchanges, liquidity usually comes from pools funded by liquidity providers, while on centralized exchanges it comes from market makers and active order books.
The Core Reasons Holders Are High but Liquidity Is Low
The most common reason is that many holders own tiny amounts and do not actively trade. A wallet holding $12 of a token is still counted as a holder, but it contributes almost nothing to market depth. Holder count can therefore rise sharply during an airdrop, referral campaign, or low-cost mint without creating real sell-side or buy-side liquidity.
1. Airdrops Create Addresses, Not Markets
Airdrops are designed to distribute tokens broadly. That can produce impressive holder statistics, but recipients may not want the token, may not know how to trade it, or may hold it in a wallet that never interacts with an exchange.
For example, imagine a project sends 1,000 tokens to 500,000 wallets. If the average allocation is small and most recipients never sell, the project can claim hundreds of thousands of holders. But if only $300,000 sits in a DEX pool, a trader trying to exit $50,000 may push the price down sharply.
Key distinction: Distribution is a supply-side fact. Liquidity is a market-structure fact.
2. Most Supply May Be Locked, Staked, or Inactive
Tokens can sit in vesting contracts, staking contracts, treasuries, bridges, or long-term wallets. Those balances count toward total holders and sometimes circulating supply, but they are not necessarily available for immediate trading.
This is why a token can show a large market capitalization while its tradable float and liquidity pool remain tiny. Market cap is calculated from price and supply, but it does not tell you how much capital is actually available to facilitate trades.
| Metric | What It Measures | What It Does Not Guarantee |
|---|---|---|
| Holder count | Number of addresses with a balance | Active demand or sell pressure |
| Market cap | Price multiplied by supply | Ability to exit a position |
| Trading volume | Value traded in a period | Sustainable liquidity or honest volume |
| Liquidity depth | Capital available near the current price | Long-term holder conviction |
| Slippage | Price impact of a trade | Whether the token is fundamentally sound |
3. Liquidity Pools Can Be Extremely Small
On automated market makers, liquidity depends on the assets deposited into a pool. A token may have a $50 million market cap but only a $250,000 liquidity pool. In that situation, even modest sales can create severe price impact.
On-chain liquidity refers to the value locked in liquidity pools or available for immediate trading through AMMs; it determines price slippage. Trading volume, by contrast, is the value traded over time and can occur on-chain or on centralized venues.
A useful rule: compare the size of the liquidity pool with the size of trades you might realistically make. If a $5,000 purchase causes visible slippage, the pool is too shallow for comfortable trading.
4. Volume Can Be Thin, Fragmented, or Artificial
A token may appear on several exchanges and DEXs, but liquidity can be split across many small pairs. Fragmentation reduces depth on each individual venue. A token with $2 million in daily volume spread across 20 illiquid pools may offer less usable liquidity than a token with $500,000 concentrated in one deep market.
Volume also deserves skepticism. Wash trading, incentive-driven farming, and short-lived speculation can inflate reported activity. Depth is often the more honest test because it shows how much size the order book or pool absorbs before the price moves against the trader.
5. Holder Concentration Can Trap the Float
A large holder count does not rule out concentration. Ten wallets might control most of the supply while hundreds of thousands of small wallets share the remainder. If those large wallets are team treasuries, early investors, market makers, or related addresses, the effective float can be much smaller than the headline supply suggests.
Address distribution is not the same as entity ownership: one address may represent an exchange, a contract, a treasury, a bridge, or many users. Conversely, several addresses may be controlled by the same person or organization.
Pro Tip: Before judging concentration, label the top holders. Exclude burn addresses, liquidity-pool contracts, known exchange wallets, and verifiable vesting contracts. Then assess the remaining “free float” and ask whether any unidentified wallet could materially affect the market.
6. Market Makers May Be Absent or Withdrawn
On centralized exchanges, professional market makers place continuous buy and sell orders, narrowing spreads and providing depth. If a project cannot attract or retain a market maker—or if the market maker withdraws during volatility—the order book can become sparse.
This often appears after a listing honeymoon ends. Volume declines, spreads widen, and the token becomes vulnerable to sharp moves from relatively small trades. Kaiko’s liquidity research highlights how concentrated crypto liquidity is across major platforms, which means smaller or poorly supported tokens may have limited access to durable order-book depth.
7. Token Unlocks Can Discourage Liquidity Provision
If investors know that a large unlock is approaching, liquidity providers and market makers may reduce exposure. They do not want to provide the other side of a trade when a large holder could soon sell into the market.
This creates a feedback loop:
-
Anticipation of unlocks reduces liquidity.
-
Reduced liquidity increases slippage.
-
Higher slippage discourages ordinary traders.
-
Lower trading activity makes the market even thinner.
The result is a token that looks widely owned but becomes progressively harder to trade.
Why This Matters More Than Holder Count
Liquidity determines your real exit price, while holder count only describes how many wallets own the asset. A token with shallow liquidity can turn a paper gain into a much smaller realized gain once you try to sell.
Consider a simple scenario:
-
A trader buys $20,000 of a token.
-
The token rises 50% on-screen.
-
The trader tries to sell $20,000.
-
The DEX pool has only $180,000 in liquidity.
-
Execution causes 8% slippage.
-
The trader receives materially less than the displayed portfolio value suggested.
The price chart showed a gain. The liquidity conditions determined what the trader could actually capture.
How to Evaluate Liquidity Before Buying
Check liquidity depth, holder quality, venue coverage, and unlock schedules before relying on holder count. A five-minute review can prevent a common mistake: treating a large community as a substitute for a functioning market.
Step 1: Identify the Correct Contract
Start with the official project documentation or a reputable aggregator. Confirm the chain, token contract address, decimals, total supply, and circulating supply. Scammers sometimes create imitation tokens with similar names and inflated holder counts.
Step 2: Review Top Holders
Open the token’s block-explorer page and inspect the top 10 to 20 holders. Ask:
-
Are they liquidity pools, staking contracts, exchanges, bridges, or treasuries?
-
Are several wallets funded from the same source?
-
Do unidentified wallets hold a large share of supply?
-
Is the top-10 share rising or falling over time?
A holder list shows balances and relative shares, but it requires context because large addresses may represent contracts, exchanges, vesting schedules, or pooled user funds.
Step 3: Measure Real Liquidity Depth
Do not stop at 24-hour volume. Look at the liquidity pool size, order-book depth, spread, and estimated slippage for a realistic trade size.
For DEX tokens, check:
-
Total pooled liquidity
-
Token side versus paired-asset side
-
Liquidity across pools and chains
-
Price impact for $1,000, $10,000, and $100,000 trades
-
Whether liquidity is locked, owned by the team, or removable
For exchange-listed tokens, check:
-
Bid-ask spread
-
Order-book depth within 1% and 2% of price
-
Volume by venue
-
Whether volume is concentrated in one pair or fragmented across many
Depth measures how much size the market can absorb before price moves against you; that is more informative than raw volume alone.
Step 4: Compare Market Cap to Liquidity
A simple screening ratio is:
There is no universal “safe” number because token design, chain, and market conditions differ. But an extremely high ratio—such as a $500 million market cap supported by a $200,000 pool—signals that price and tradability may be disconnected.
Step 5: Check Unlocks and Emission Schedule
Look for vesting cliffs, team unlocks, investor unlocks, staking emissions, and liquidity incentives. A large unlock can overwhelm a shallow market even if the project has strong fundamentals.
Ask three questions:
-
When does the next major unlock occur?
-
How large is it relative to daily trading volume?
-
Are recipients likely to sell, stake, or hold?
Step 6: Watch Trading Behavior Over Time
Healthy liquidity usually shows consistent participation across days and venues. Warning signs include volume spikes followed by dead markets, liquidity that disappears during downturns, widening spreads, and a holder count that rises while active addresses and volume fall.
The Unlock Overhang: Millions of Holders, a Calendar Full of Sell Pressure
Token unlocks convert locked supply into liquid supply, and when a token already has thin liquidity, each unlock event acts as a scheduled dilution shock rather than a gradual distribution. The holder count may be large, but the marginal seller — the insider whose tokens have just become transferable — can overwhelm the available bid depth.
Keyrock reviewed more than 16,000 token unlock events and found a recurring pattern: drawdowns typically begin building 30 days before an unlock, intensify in the final week, and stabilize around two weeks afterward. The market learns to front-run the supply increase. Liquidity providers and market makers widen spreads or reduce inventory ahead of the event. The holder count stays the same; the willingness to provide a two-sided market does not.
The Pump.fun unlock in July 2026 illustrates the mechanics. A 12-month vesting cliff ended, distributing 57.279 billion PUMP tokens across 121 wallets — supply representing nearly twice the token’s daily trading volume. The unlock did not automatically mean selling, but it shifted the probability of selling sharply upward. In a market with deep liquidity, that supply can be absorbed over time. In a market with millions of holders but shallow order books, the unlock becomes a standing overhang that every participant can see coming.
A project can have a thriving community, a large holder base, and a credible product roadmap — and still suffer from unlock-driven liquidity erosion if the float was engineered to be small from the beginning.
Market Depth vs. Trading Volume: The Metric That Actually Matters
Trading volume tells you how much changed hands; market depth tells you how much can change hands at a stable price. Volume is a flow metric. Depth is a buffer metric. A token can print $50 million in daily volume and still slip 10% on a $10,000 market order if the order book is thin.
Here is how the two diverge in practice, and what to look for in each:
| Metric | What It Measures | Red Flag Threshold | Why It Misleads |
|---|---|---|---|
| 24h Trading Volume | Total value traded in a day | Under $100,000 daily (for small caps) | Can be inflated by wash trading or concentrated on a low-liquidity venue |
| Holder Count | Number of wallets holding the token | Not meaningful on its own | Airdrops, Sybil wallets, and exchange omnibus accounts distort the count |
| Order Book Depth (±2%) | Bids and asks stacked within 2% of the mid-price | Under $20,000 total within ±2% | Low depth means a modest market order blows through multiple price levels |
| Bid-Ask Spread | Gap between best bid and best ask | Above 1–2% | A wide spread is a direct tax on every round trip |
| Slippage on $10k Order | Price impact of a standardized trade | Above 0.5% | Slippage scales non-linearly in AMM pools: a trade equal to 1% of the pool causes roughly 2% slippage; 10% of the pool can cause 25%+ |
A token can pass the holder-count test and fail every single liquidity metric in this table. That is the gap the holder-count illusion is built to hide.
**Pro Tip — The $10,000 Test:** Before buying any token you have not traded before, simulate a $10,000 market sell on the primary venue. If the estimated slippage exceeds 1%, your position size is already too large for the market. In illiquid tokens, the difference between a 2% exit and a 12% exit is often determined before you enter, not when you decide to leave.
Case Study: Two Tokens, Same Holder Count
Imagine two fictional tokens, each with one million holders.
| Factor | Token A | Token B |
|---|---|---|
| Holders | 1,000,000 | 1,000,000 |
| Market cap | $80 million | $80 million |
| DEX liquidity | $6 million | $250,000 |
| Top 10 non-contract holders | 12% of supply | 63% of supply |
| Average trade slippage on $10,000 | 0.15% | 6.8% |
| Volume pattern | Consistent across venues | One-day spikes |
| Practical takeaway | Tradable, though still risky | High exit-risk token |
Both tokens look equally “community-owned” if you only read the holder count. Token B, however, has a shallow pool and concentrated non-contract holdings. Its holders may be numerous, but the market is fragile.
This is why professional researchers read concentration alongside liquidity depth, volume, related-wallet links, and whether a large holder can sell without collapsing the market.docs.
Red Flags That Suggest Low Real Liquidity
The biggest red flag is a large market cap paired with a tiny liquidity pool or thin order book. Other warning signs include:
-
A holder count that grows faster than active addresses or trading volume.
-
Several unlabeled wallets holding large percentages of supply.
-
Liquidity concentrated in one small pool or one obscure exchange.
-
High slippage on ordinary trade sizes.
-
Volume that appears only during promotional campaigns.
-
Liquidity controlled by a team wallet that can be withdrawn at any time.
-
A large upcoming unlock relative to daily volume.
-
Price moves that are disproportionate to the size of recent trades.
Low trading volume relative to market capitalization, reliance on a single obscure DEX, and high supply concentration are commonly cited indicators of poor crypto liquidity.
Expert Insight: Ask the Exit Question First
Before buying, ask: “If I needed to sell 1% of this token’s daily volume tomorrow, what price would I receive?”
That question forces you to think beyond marketing metrics. A token may have a passionate community, millions of holders, and an impressive social-media presence, but none of those guarantee that a seller can exit at the displayed price.
A more disciplined approach is to size positions according to liquidity, not according to conviction alone. If a token’s realistic exit liquidity cannot support your intended position size, the position may be too large—even if the investment thesis is strong.
How Projects Can Improve Liquidity
Projects improve liquidity by creating durable, transparent, and well-incentivized markets—not by chasing holder-count milestones. Practical approaches include:
-
Partnering with reputable market makers under clear, disclosed arrangements.
-
Building deeper DEX pools with locked or time-vested liquidity.
-
Listing on venues appropriate to the token’s actual trading demand.
-
Avoiding excessive fragmentation across low-quality pairs.
-
Publishing unlock calendars and treasury policies.
-
Designing incentives that reward sustained liquidity provision rather than short-term farming.
-
Communicating clearly about circulating supply, reserves, and contract-owned tokens.
Liquidity mining can attract liquidity providers by rewarding them with the protocol’s native token, but incentives must be designed carefully; otherwise, liquidity may arrive only while rewards last.
What Would Actually Fix the Liquidity Gap
The holder-count illusion is not an accident of market psychology. It is the predictable output of incentives that reward reach over depth.
Projects are incentivized to maximize holder count because large communities attract exchange listings, social attention, and the appearance of decentralization. Market makers are incentivized to report volume rather than maintain two-sided depth, because volume is easier to measure and easier to manufacture. Launch structures are incentivized toward low float and high FDV because that is what protects insider valuations at the token generation event.
The correction, where it happens, comes from changing what gets measured. Some projects are experimenting with KPI-based unlocks, revenue-linked buybacks, and fully transparent token sales — structures that align supply releases with actual usage rather than a calendar. On the market-making side, a shift away from “token loan plus call option” arrangements toward transparent custody or service-fee models would reduce the conflict of interest that can turn market makers into sellers during stress.
For traders, the fix is simpler and entirely within your control: stop treating holder count as a proxy for safety. A million holders is a community metric. A deep order book is a survival metric. The tokens that survive the next liquidity cycle will be the ones where those two numbers are allowed to converge.
The Takeaway
Millions of holders and little liquidity is not a contradiction. It is a design outcome. Low-float launches manufacture large holder bases while keeping tradeable supply scarce. Airdrops and incentives create wallet counts without creating bid depth. Wash trading and fake wallets inflate the appearance of activity. Unlock schedules load future sell pressure onto markets that were never built to absorb it. The holder count is the loudest number on the page and the least relevant to whether you can exit at the price you see.
Before your next trade, close the community tab and open the order book. The depth within ±2% will tell you more about the real market than a million wallets ever could.
Next step: Run the five-step liquidity audit above on a token you currently hold. If the round-trip cost exceeds 2% or the next unlock is larger than a full day of volume, you have found the gap — and you have found it before it found you.
FAQs
Why does a crypto token have millions of holders but low liquidity?
Because holder count counts addresses, while liquidity measures available trading depth. Many holders may own tiny amounts, hold locked tokens, or never trade, leaving a shallow market despite broad distribution.
Is high holder count good for a crypto token?
It can indicate broad distribution, but it is not proof of demand, decentralization, or liquidity. A large holder base can result from airdrops, micro-balances, bots, or inactive wallets.
What is more important: trading volume or liquidity depth?
Liquidity depth is usually more important for assessing trade execution because it shows how much size can be traded near the current price. Volume can be temporary, fragmented, or manipulated, while depth directly affects slippage.
How can I check whether a token’s liquidity is real?
Review the liquidity pool size, order-book depth, spread, slippage at realistic trade sizes, top-holder labels, and volume across venues. Compare market cap with available liquidity and check whether liquidity is locked or removable.
Can a token with low liquidity still be a good investment?
Yes, but it carries higher execution and volatility risk. A strong thesis does not eliminate the possibility that selling will be difficult or that a large holder, unlock, or market-maker withdrawal will sharply affect price.
What is the difference between trading volume and liquidity depth?
Volume measures total value traded over a period. Depth measures how much can be bought or sold near the current price without moving it. A token can show $50 million in volume but slip 10% on a $10,000 order if the order book is thin.
How can I check if a crypto token’s liquidity is real?
Open the order book and check depth within ±2% of the price. If total bids and asks in that band are under $20,000, the market is exit-constrained. Also simulate a small round-trip trade and measure the total spread and slippage cost.
What happens to liquidity when a token unlock occurs?
Liquidity typically deteriorates before and around an unlock. Research on over 16,000 unlock events found that drawdowns build roughly 30 days before the event, intensify in the final week, and stabilize about two weeks afterward as the market reprices for new sellable supply.
Next Steps
Before buying a token with a large holder count, run the same diligence you would apply to any market: verify the contract, label major holders, measure depth at your intended trade size, compare market cap with liquidity, and map unlock dates. Holder count can tell you that a token is widely distributed; liquidity tells you whether you can actually trade it.
If you want a practical next step, create a simple pre-buy checklist with four thresholds: liquidity depth for your position size, top-10 non-contract concentration, market-cap-to-liquidity ratio, and the next major unlock. Treat any token that fails two or more of those checks as a liquidity-risk position—not merely a “community token.”